SmartyGrants stats report reveals grants funding roller coaster
Posted on 11 Feb 2022
By Matthew Schulz, journalist, Our Community

A landmark study into more than $6 billion in grants funding over eight years involving more than half a million applications has tracked huge fluctuations in spending by Australian funders.
It is hoped that the study will prompt grantmakers and grantseekers to consider their own funding priorities and processes.
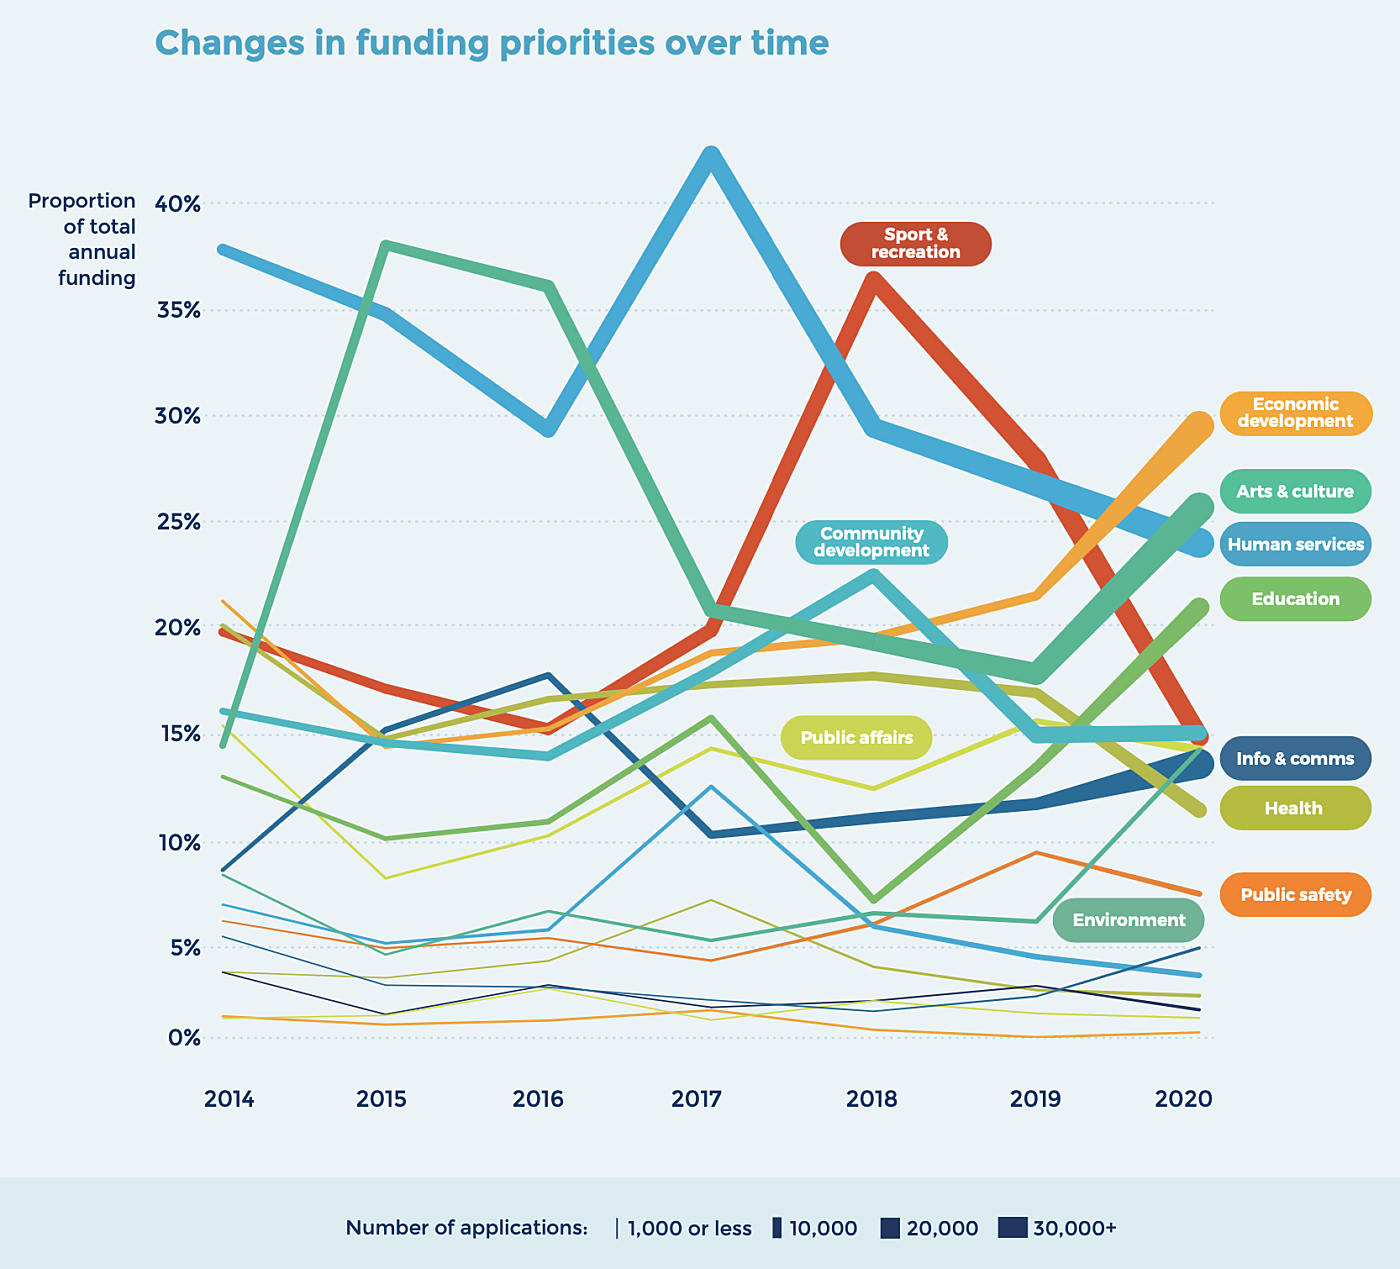
The Future of Funding: What are the priorities and directions of Australian grantmakers? analyses funds distributed on the SmartyGrants platform between 2013 and 2020.
SmartyGrants is Australia’s most used grants platform and the funding patterns are indicative of some of the country’s biggest grants priorities.
The SmartyGrants study used the platform’s classification system CLASSIE to separate grants into social sector subject areas to show how the money flowed, including the impact of the onset of the covid-19 pandemic.
Watch now: Webinar featuring an analysis of implications from the report with grantmaking experts | Start the conversation now on the SmartyGrants forum
Key findings in the report by Our Community Innovation Lab data scientist Dr Nathan Mifsud include these:
- The areas attracting the most funding are human services, sport and recreation, arts and culture, and community development, adding up to nearly half of the total funding
- State and territory grantmakers distribute the most funds on the SmartyGrants system
- Approval rates for local government grants were significantly higher than for any other funder until they dipped markedly during the covid-19 pandemic
- Government funders are more likely than other funders to support arts and culture, and sport and recreation
- Philanthropic funders are more likely than other funders to support health
- Applications spiked across the board as covid-19 hit
- The pandemic sparked some radical shifts in spending, including a big rise in grants for information and communications and economic development, while sport and recreation funding dipped.
You can read more about the report’s findings on covid-19 responses here, as well as a related piece guiding grantmakers wanting to do better with information and communications funding here.
SmartyGrants chief technology officer Sarah Barker said the study immediately prompted questions in her mind about:
- the relatively low approval rates for federal/state and philanthropic funders and what they could do to improve them
- what funders should consider in the covid-19 “rebound”, such as more fast-response grants (read our quick-response grants special edition), or additional larger grants and partnerships
- what future priorities grantmakers will need to consider.
She believed grantmakers should “inject best-practice grantmaking principles” into how they read the study, with guidance available in the SmartyGrants Grantmaking Toolkit.
Grants study should ‘start a conversation’ about funding fluctuations
Even without covid-19, funding flows changed dramatically over the study period, with spikes and troughs affecting spending in every subject area.
The funding variations have a range of causes including the impact of major campaigns, political imperatives and policies, and of course covid-19 itself.
Report author Dr Mifsud said grantmakers and not-for-profits would be able to identify with some of the trends highlighted in the report.
“Funding priorities are not static but are continually contested,” Dr Mifsud said.
He said the true value of the report was in the conversations that it was expected to spark among leading funders and not-for-profits as they examined the implications of the figures and compared their own priorities with those identified in the study.
“All these kinds of analyses provide templates, if you will, for grantmakers wanting to think about their own data and their own funding patterns.”
“We don’t need to tell grantmakers what they’ve experienced over recent years because they already know it. And in fact, each of their experiences could be very different because this is an aggregate view of the whole sector.
“An example of that would be in information and technology, which showed a spike in demand for ICT funding during 2020. If you were willing to fund it, but you didn’t get those applications, that should spark a question: Why didn’t we get those applications?
“Was it that our grant rounds weren’t well advertised, or was it that we didn’t make clear that funding was available for that? Or was it simply that the organisations we’re serving didn’t actually have that need, or had more urgent priorities?
“The report should help people to come up with questions to refine their grant offer, to refine their grant processes and to improve relationships with their grantseekers.”
Grants data reveals the value of quick response funding
Grantmakers should retain the agility that enabled a massive spike in funding distributions related to the pandemic, a team of SmartyGrants grants experts has urged.
Discussing the report Future of Funding: What are the priorities and directions of Australian grantmakers?, author Dr Mifsud joined SmartyGrants’ director of special projects Joshua Presser, and Our Community executive director Kathy Richardson to explored the huge fluctuations in spending.
In response to the finding that grant applications leapt during the pandemic, Ms Richardson said grantmakers had a chance to retain some of the streamlining that enabled money to flow faster during funders’ initial covid-19 responses.
“One thing that grantmakers did exceptionally well during covid is that they sped up. My plea on behalf of grantseekers would be: whatever you did during that period … keep doing that.”
“Don’t stop just because the immediate crisis has passed. Have a look at what you could keep on doing.”
She said that during the pandemic grantmakers “streamlined” risk assessments, and in some cases ditched acquittals completely.
“A lot of grantmakers went to grantees that they had long-term relationships with, that they trusted, and just said, ‘Tell us what you need.’ They didn’t even have an application form.”
“I would urge funders to take these lessons and try to bring them into your everyday life.”
She said the same principles could be applied to bushfires and the floods devastating northern NSW and south-east Queensland, and that with more disasters likely as a result of climate change, such rapid responses would need to be part of “business as usual”.
Ms Richardson’s comments were part of a wide-ranging discussion about the report, which she said, in many ways, “raised even more questions than it answered”.
Data's value will grow over time
Dr Mifsud said the Innovation Lab’s data scientists would continue to work with SmartyGrants to inform the platform’s software development, including the development of new tools that would increase the ability of funders to understand the impact of grants activity. A similar study focusing on the Australian grantmaking sector’s alignment with the United Nations Sustainable Development Goals would be released soon, he said.
Past investigations have informed the development of SmartyGrants Maps, the Outcomes Engine, CLASSIE and CLASSIEfier.
“These all came out of grantmaker needs”, he said.
“I think the data will become more valuable over time as we build more context around it.”
Approval rates vary strongly between sectors
An area that has triggered many discussions among funders is approval rates. An approval rate is the percentage of applications submitted that are marked as “approved” within the system.
As Ms Barker points out, low approval rates may indicate that grantseekers are expending unnecessary resources by applying for, yet not winning, funding. That could raise flags for organisations that track lower than the average benchmarks for their sector.
Depending on the sector, SmartyGrants approval rates can be markedly different. For example, approval rates by federal grantmakers have stabilised from a high of 58% in 2013 and a low of 27% in 2016 to be hovering at 41% at last count and close to that figure since 2017.

State and territory approvals were just over 50% in the years to 2019, before a spike to 66% coinciding with the pandemic.
Local government approvals were the highest, staying at or above 70% between 2015 and 2019, before a sudden dip to 54% as the pandemic hit. Most of the rejected applications were for lower value grants in the $1,000 to $5,000 range.
Philanthropic grant approval rates have been relatively stable in the high 30s and low 40s, with the latest rate at 43%.
Funding priorities are mixed
Funding for human services is by far the biggest slice of the grants pie for the federal government, with arts/culture and economic development the next biggest recipients. By comparison, the highest priority for state and territory grantmakers was sport and recreation, followed by human services and economic development.
That aligns with the latest CLASSIE analysis, which shows the natural environment, children and youth, and sports people are the most likely targets of federal government spending.
Dr Mifsud said it was important to understand that some beneficiary labels could be broadly applied. For example, funding for “sports people” is not restricted to professional sport, but in fact most of it pays for infrastructure, such as tennis courts, cycle paths, gyms and amenity blocks.
In local government, human services are the top priority, followed by sport and recreation, arts and culture, and community development. The biggest beneficiaries of local government grants include urban and metro dwellers, sports, the natural environment, and people with disabilities.
Philanthropic funders are most likely to fund health and human services, with their key beneficiaries including diseases and illness, students and academics, people with disability, and then children and youth.
More information
The Future of Funding: What are the priorities and directions of Australian grantmakers?
Not-for-profits rely on technology too – so where’s the funding?
Grantmakers shift focus, funding and processes, SmartyGrants covid-19 grantmaking survey shows
Federal figures reveal how $60 billion dollars’ worth of federal grants funding flows
How SmartyGrants responded to the covid-19 emergency
Grants in Australia research study: Insights from an analysis of grantseekers
More SmartyStats: How applicants are lodging forms | Funders faster to respond to applications